

Overview
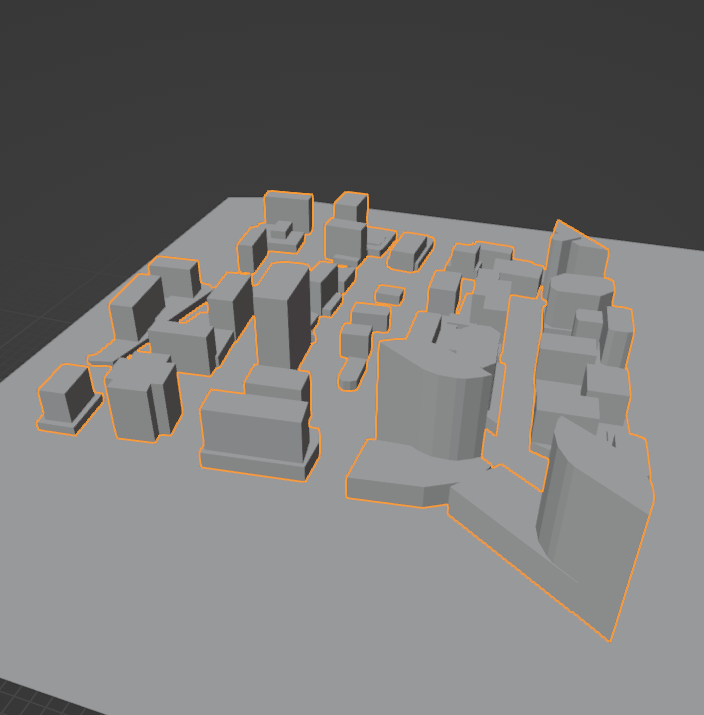
Scenario 7 is a synthetic street-level urban canyon scenario with fixed vehicles, ray-traced channels at 60 and 28 GHz. In this scenario, the base station antenna is positioned at 4m height from the surface making the link more vulnerable to dynamic blockages (buses, trucks) and cornering. Rosslyn urban scenario is configured with 200 episodes of 10 scenes each, time between scenes of 1ms, time between episodes of 35s, 10 fixed receivers and 1 fixed transmitter. In addition, the scenario explicitly models vegetation (foliage) effects on the wireless channel, accounting for extra attenuation introduced by trees and green areas along the propagation paths. This enables evaluating how foliage impacts path loss and link reliability at 28/60 GHz.
Rosslyn Avenue
Rosslyn Avenue (Arlington, VA – Approx. Lat/Long: 38.8950° N, 77.0715° W)is located in the dense urban core of Rosslyn, Arlington, VA, forming part of a grid of narrow streets surrounded by mid- and high-rise buildings. The modeled portion of the avenue in this scenario is a two-way urban street with no marked lanes (common in narrower segments of the Rosslyn district). The effective road width is approximately 8–10 meters, supporting slow, mixed traffic flow. The typical speed limit ranges from 25 to 30 mph (≈ 40–48 km/h), characteristic of urban business districts with frequent intersections and pedestrian activity. Traffic is composed of cars, SUVs, delivery vans, buses, and occasional trucks, all of which introduce diverse mobility patterns and dynamic blockages. From a wireless communication perspective, the absence of lane markings, combined with the narrow street geometry and tall surrounding buildings, produces a pronounced urban canyon effect. Vehicles moving close to the base station line-of-sight can create partial or complete blockages, while buildings generate significant multipath via reflections and diffractions. These characteristics make Rosslyn Avenue a challenging and representative environment for evaluating beam tracking, blockage prediction, and mmWave/6G communication robustness.
Collected Data
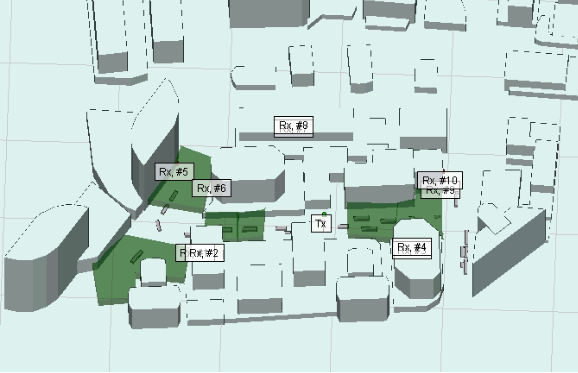
The collected data was generated using the Raymobtime pipeline, which couples vehicular traffic simulation in SUMO with scene generation and ray-tracing in Remcom Wireless InSite (WI) via a Python orchestrator. In the “fixed receivers” configuration, both the transmitter (base station) and the receiver nodes are kept at fixed, predefined locations across the whole episode. However, vehicular flows (vehicles without antennas) are still simulated in SUMO and injected into each scene as dynamic objects, so the environment evolves over time. As a result, the temporal variability in the channel comes from moving blockers and changing propagation conditions (e.g., buses/trucks occlusions and cornering effects), rather than from receiver mobility.
1. Ray tracing data: top 25 rays of highest received power, obtained from Wireless Insite (WI).
- Received power, time of arrival, elevation angle of departure, azimuth angle of departure, elevation angle of arrival, azimuth angle of arrival, LOS condition.
- Type data: .hdf5 of each episode
- At database .db file is possible take rays paths and interactions information.
Data Visualization
Dataset details
| 3D scenario | Rosslyn |
| Frequency | 60 and 28 GHz |
| Number of receivers and type | 10 Mobile |
| Number of episodes | 200 |
| Number of scenes per episode | 10 |
| Time between scenes | 1 ms |
| Time between episodes | 35s |
| Number of runs | 2000 |
| Number of valid channels | 20K |
Simulation details
- Traffic parameters (Simulator of Urban Mobility)
| Number of lanes | 4 |
| Vehicles | Car, Truck, Bus |
| Lengths, respectively (m) | 4.645, 12.5, 9.0 |
| Heights, respectively (m) | 1.59, 4.3, 3.2 |
| Probabilities, respectively (m) | 0.7, 0.1, 0.2 |
| acceleration, respectively (m/s2) | 3, 2, 2 |
| deceleration, respectively (m/s2) | 4.5, 4, 4 |
| Max vehicles speed (m/s) | 17.8 |
| Average speed (m/s) | 8.2 |
| Sampling period (s) | 0.1 |
- Elements and materials (WI)
| Elements | Material |
| Buildings | ITU Concrete 60 GHz, DS: 0.4 |
| Ground | ITU Concrete 60 GHz, DS: 0.4 |
| Vehicles | PEC Metal, DS: 0.2 |
| Folliage | Dense and Sparse Deciduous, N/A DS |
- Transmitter details (WI)
| Number and type | 1 Fixed |
| Antenna type | Isotropic |
| Input power | 0 dbm |
| Position (x,y,z) (m) | 743.9, 561.9, 4.0 |
- Receiver details (WI)
| Number and type | 10 Fixed |
| Plataform type | Point |
| Antenna type | Isotropic |
| Noise figure | 3 dbm |
| Positions Rx1-Rx10 (x,y,z) (m) | (777,455,3),(776,463,3),(768,637,3),(768,637,10),(702,435,3),(716,467,3),(658,534,3),(658,534,9),(711,659,3),(702,658,3) |
- Ray tracing configuration (WI)
| Propagation model | X3D |
| Number of reflections | 6 |
| Number of transmissions | 0 |
| Number of diffractions | 1 |
| Number of rays | 25 |
| Ray spacing | 1° |
| Folliage Model | Weissberger Model |
- Diffuse Scattering configuration (WI)
| Diffuse scattering | Habilited |
| Model | Lambertian |
| Max reflections | 2 |
| Max transmissions | 0 |
| Max diffractions | 1 |
- Signal Information (WI)
| Signal type | Sinusoid |
| Frequency | 60 and 28 GHz |
| Bandwidth | 1 MHz |
Wireless Insite:
The Rosslyn scenario used at simulations corresponds to a 3-D model that is part of Wireless insite examples.
The RT area of study is a rectangle of approximately 694.286 × 709.974 m2.
The simulation was realized at wireless insite 3.2
OBS: The ray phase is available ONLY in simulations that used Wireless Insite (WI) 3.3 Version or superior. The p2m files generated by WI 3.2 do not include the ray phase information. Therefore, the hdf5 files of WI 3.2 have one less parameter than the ones obtained with WI 3.3. When using a WI 3.2 dataset, one typically generates a random phase to play the role of the ray phase.
Download & Citation
If you want to use the dataset or scripts on this page, please use the link below to generate the final list of papers that need to be cited.
Files and folders explanation
📁 1. s000_episodedata — Objects and rays database (db)
Database with tables where episodes, scenes, mobile objects and receivers are related.
Tables:
[episodes, scenes, objects, rays, receivers]
Util information at tables:
– Rays (table)
[id, departure_elevation, departure_azimuth, arrival_elevation, arrival_azimuth, path_gain, time_of_arrival, interactions, receiver_id]
– Receiver (table)
[id, total_received_power, mean_time_of_arrival, object_id]
– Object (table)
[id, name, scene_id]
– Scene (table)
[id, episode_id]
📁 2. ray_tracing_data_s000_carrier60GHz/ — Rays Information (HDF5)
The ray-traced data is stored in HDF5 format using a four-dimensional structure:
Structure:[number of scenes, number of TX–RX pairs, maximum number of rays, number of stored parameters]
Each ray contains:
- Received power (dBm)
- Time of arrival (seconds)
- Elevation angle of departure (degrees)
- Azimuth angle of departure (degrees)
- Elevation angle of arrival (degrees)
- Azimuth angle of arrival (degrees)
- LOS flag: 1 = LOS, 0 = NLOS
This data enables high-fidelity reconstruction of multipath behavior, reflections, diffractions, and critical LOS/NLOS transitions.
📁 3. documentation/ — README and Citation Information
This folder contains:
- Dataset README
- License and usage rules
- Citation generator references
- Links to related academic papers
- Change logs or updates