

Overview


Scenario 10 is a synthetic street-level urban canyon scenario with mobile vehicles, ray-traced channels, GPS and full MIMO channel matrices at 60 GHz. In this scenario, the base station antenna is positioned at 5m height from the surface making the link more vulnerable to dynamic blockages (buses, trucks) and cornering. Rosslyn urban scenario is configured in 60GHz, with 105 episodes of 20 scenes each, 10 mobile receivers and 1 fixed transmitter.
Rosslyn Avenue
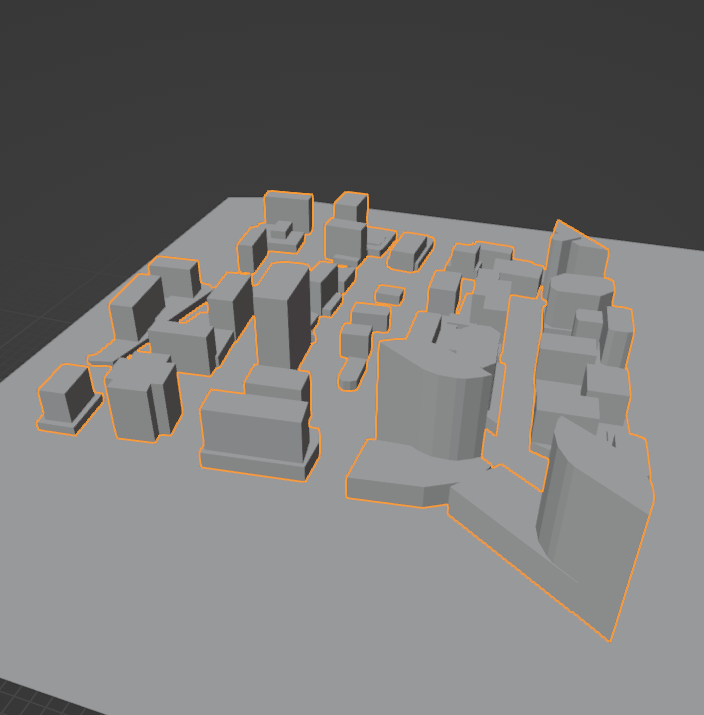
Rosslyn Avenue (Arlington, VA – Approx. Lat/Long: 38.8950° N, 77.0715° W) is located in the dense urban core of Rosslyn, Arlington, VA, forming part of a grid of narrow streets surrounded by mid- and high-rise buildings. The modeled portion of the avenue in this scenario is a two-way urban street with no marked lanes (common in narrower segments of the Rosslyn district). The effective road width is approximately 8–10 meters, supporting slow, mixed traffic flow. The typical speed limit ranges from 25 to 30 mph (≈ 40–48 km/h), characteristic of urban business districts with frequent intersections and pedestrian activity. Traffic is composed of cars, SUVs, delivery vans, buses, and occasional trucks, all of which introduce diverse mobility patterns and dynamic blockages. From a wireless communication perspective, the absence of lane markings, combined with the narrow street geometry and tall surrounding buildings, produces a pronounced urban canyon effect. Vehicles moving close to the base station line-of-sight can create partial or complete blockages, while buildings generate significant multipath via reflections and diffractions. These characteristics make Rosslyn Avenue a challenging and representative environment for evaluating beam tracking, blockage prediction, and mmWave/6G communication robustness.
Collected Data
1. Statements: Mobility scenario, communication system originally configurated as SISO.
From this statement some data from simulation were collected.
2. GNSS: Positions of receivers (obtained from SUMO mapping).
- Latitude, longitude and height position of each receiver antenna.
- Type data: .csv
- At database .db file is possible take position and pointing angle of each object in scene.
3. Ray tracing data: top 25 rays of highest received power (obtained from Wireless Insite).
- Received power, time of arrival, elevation angle of departure, azimuth angle of departure, elevation angle of arrival, azimuth angle of arrival, LOS condition, ray phase.
- Type data: .hdf5 of each episode
- At database .db file is possible take rays paths and interactions information.
Data Processing
SISO -> MIMO expansion was used to generate beam forming data through array signal processing.
This is a far field approch, the arrays types generated were ULAs, which used Discrete Fourrier Cobooks (have same number of codewords that antennas on transmitter or receiver).
1. Channel output: Is the equivalent channel magnitudes
- obtained after apply precoding and combining codebooks at channel matrix constructed from rays contributions. It contains the magnitud information of each beam pair possible from codebooks given.
- Type data: .NPZ
2. Beam output: Best beam pair based on received signal strength
- The beam pair index of highest magnitud from equivalent channel
- Type data: .NPZ
3. Lidar matrix: Voxelized data from pcd data, matrix of zeros and 1
- Type of matrix: 3D
- Type of coodinate system: Cartesian
- Quantization parameters: X: [744, 767] step 1.15. Y: [429, 679] step 1.25. Z: [0, 10] step 1
- Type data: .NPZ
Data Visualization
Illustrative figures of Scenario 14:
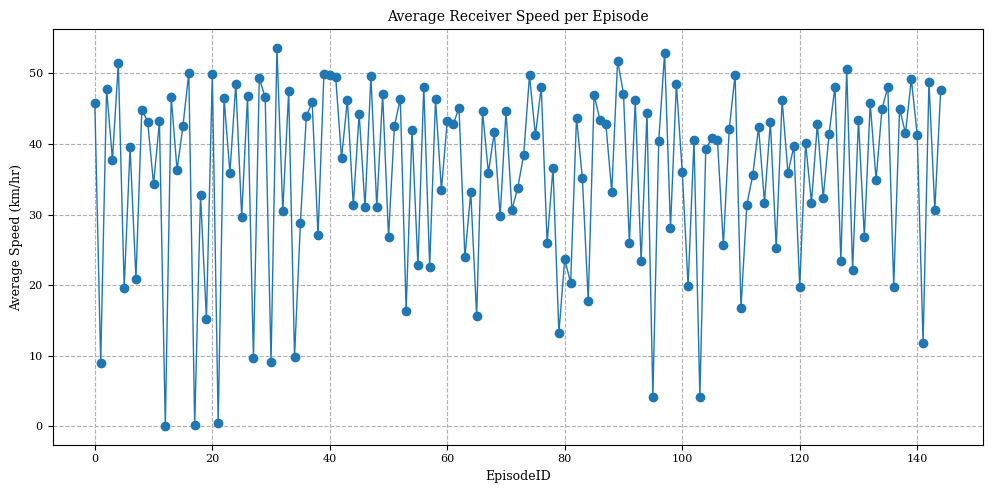
1. Average Receiver Speed per Episode
Shows how receiver speeds vary across episodes, reflecting realistic SUMO-generated traffic patterns. These variations influence beam stability and LOS transitions during mobility.
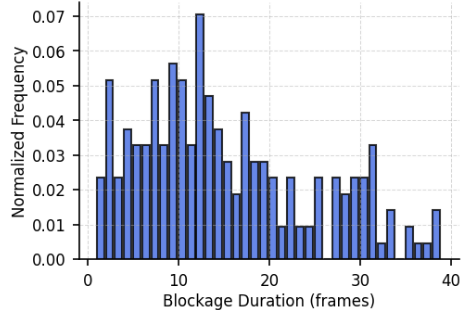
2. Blockage Duration Distribution
Histogram of blockage lengths caused by vehicles obstructing the link. Most blockages are short, while longer ones correspond to full LOS outages from large or slow-moving vehicles.
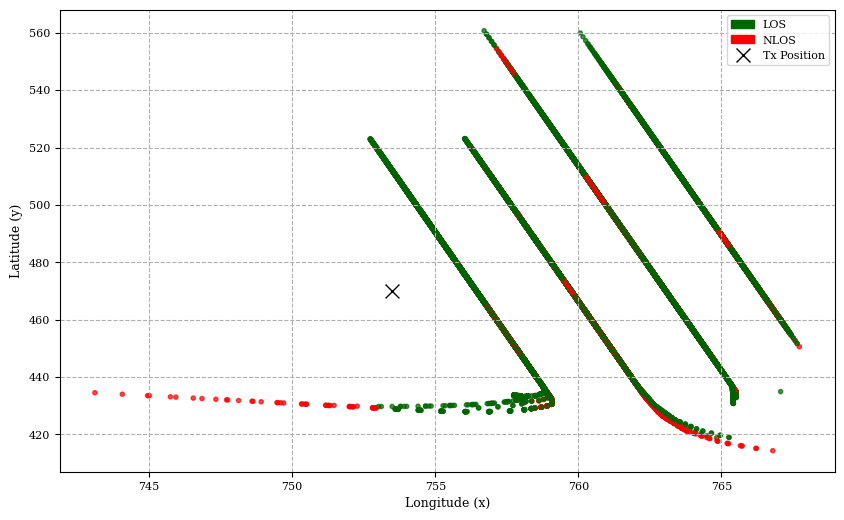
3. Receiver Trajectory with LOS/NLOS Labels
Receiver paths are displayed with LOS (green) and NLOS (red) states. Transitions occur at corners and behind large obstacles, capturing typical 60 GHz urban canyon propagation behavior.
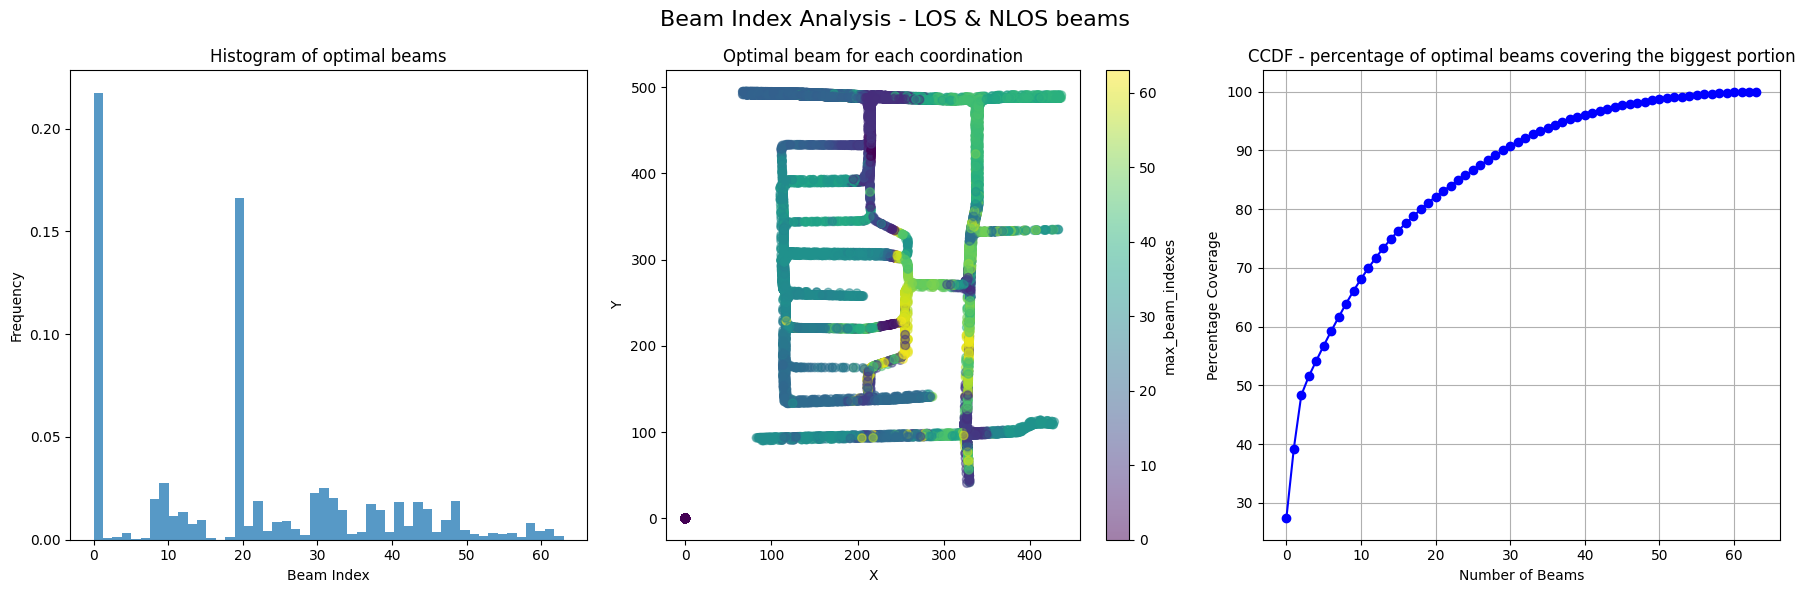
4. Beam Index analysis
Optimal Beam Histogram: Frequency of optimal beam indices across all scenes. Peaks highlight dominant AoA/AoD directions shaped by street geometry and reflective surfaces.
Beam Trajectory Over Time: Temporal evolution of optimal beams. LOS segments show smooth beam changes, while NLOS segments contain sharp jumps due to reflections and blockage dynamics.
CDF of Top-K Beam Coverage: Cumulative distribution showing how often the optimal beam appears in the Top-K predictions. High coverage at small K indicates strong spatial sparsity and efficient beam alignment potential.
Dataset details
| 3D scenario | Rosslyn |
| Frequency | 60 GHz |
| Number of receivers and type | 10 Mobile |
| Time between scenes | 0.5 s |
| Time between episodes | 5 s |
| Number of runs | 5000 |
| Number of episodes | 100 |
| Number of scenes per episode | 50 |
| Number of valid channels | 30000 |
| LOS/NLOS | ? |
| Channels Information | Number |
| Total | 30000 |
| Valids | 16967 |
| Invalids | 33033 |
| LOS cases | 30228 |
| NLOS cases | 19722 |
Number and Height of Receiver Vehicles
- 16200 trucks (height: 4.30 m)
- 7478 cars (height: 1.59 m)
- 5319 buses (height: 3.20 m)
Simulation details (nome arquivo xml)
- Wireless Insite: Elements and materials
| Elements | Material |
| Buildings | ITU Concrete 60 GHz |
| Ground | ITU Concrete 60 GHz |
| Vehicles | PEC Metal |
- Transmitter details
| Number and type | 1 Fixed |
| Antenna type | Isotropic |
| Polarization | Vertical |
| Input power | 0 dbm |
- Receiver details
| Number and type | 10 Mobile |
| Plataform type | Car, Bus, Truck |
| Antenna type | Isotropic |
| Polarization | Vertical |
| Noise figure | 3 dbm |
- Ray tracing configuration
| Propagation model | X3D |
| Number of reflections | 6 |
| Number of transmissions | 0 |
| Number of diffractions | 1 |
| Number of rays | 25 |
- Diffuse scattering configuration
| Diffuse scattering | Habilited |
| Model | Lambertian |
| Max reflections | 2 |
| Max transmissions | 0 |
| Max diffractions | 1 |
| Final interaction only | Habilited |
- Signal Information
| Signal type | Sinusoid |
| Frequency | 60 GHz |
| Bandwidth | 1 MHz |
Download & Citation
If you want to use the dataset or scripts on this page, please use the link below to generate the final list of papers that need to be cited.
Dataset Folder Structure
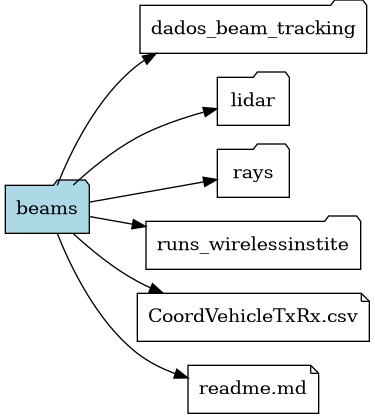
The dataset is organized into several folders, each corresponding to a different sensing or communication modality. All files follow consistent formats and indexing rules, making the dataset suitable for multimodal research in sensing, mmWave propagation, beam tracking, and machine learning.
Files and folders explanation
📁 1. channel_data/ — Ray-Traced Channels (HDF5)
The ray-traced channel data is stored in HDF5 format using a four-dimensional structure:
Structure:[number of scenes, number of TX–RX pairs, maximum number of rays, number of stored parameters]
Each ray contains:
- Received power (dBm)
- Time of arrival (seconds)
- Elevation angle of departure (degrees)
- Azimuth angle of departure (degrees)
- Elevation angle of arrival (degrees)
- Azimuth angle of arrival (degrees)
- LOS flag: 1 = LOS, 0 = NLOS
- Ray phase (degrees)
This data enables high-fidelity reconstruction of multipath behavior, reflections, diffractions, and critical LOS/NLOS transitions.
📁 2. lidar_data/ — LiDAR Point Clouds (NPZ)
LiDAR point-cloud data is provided in NPZ format as a 4D structure:
[max number of TX/RX pairs per episode, PCD(X, Y, Z)]
The point clouds use uniform quantized 3D coordinates and represent the surrounding street geometry, vehicles, and blocking structures. This modality supports research on sensing-aided beam prediction, blockage detection, and scene reconstruction.
📁 3. beam_data/ — Codebook Beam Indices (NPZ)
Beam labels are stored as NPZ files with a 3D structure:
[valid channels, Tx codebook index, Rx codebook index]
These indices correspond to the selected transmitter and receiver beams for each valid channel. They are directly compatible with beam selection, top-K accuracy evaluation, supervised training of beam predictors, and analysis of codebook-based mmWave systems.
📁 4. mimo_channel/ — MIMO Channel Matrices (NPZ)
MIMO channel matrices are stored in NPZ format as:
[number of channels, Nr, Nt, Nc]
Default configuration:
- Nr = 8 (receiver antennas)
- Nt = 8 (transmitter antennas)
- Nc = 1 (subcarrier)
- Spatial-domain channel aligned with a ULA model
This modality is used for beamforming, precoding, massive-MIMO learning models, and spatial correlation analysis.
📁 5. image_data/ — RGB Camera Frames (PNG)
The dataset includes RGB images in PNG format with resolution 1280×720.
Each scene contains images captured from three cameras mounted at the base station, each with a ~60° field of view.
These images provide contextual visual information about streets, buildings, traffic, and blockages, enabling tasks such as:
- Vision-aided beam prediction
- Scene classification
- LOS/NLOS visual inference
- Multimodal sensing and ISAC research
📁 6. gps_user_data/ — GPS and Metadata (CSV)
User metadata and GPS information are stored in CSV format with nine columns (below image with first 5 lines of the CSV file):
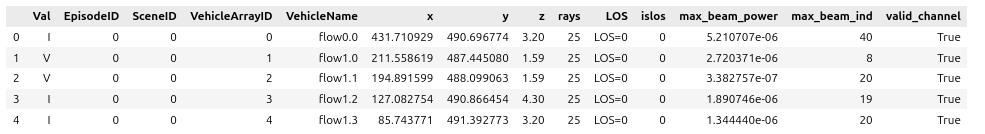
- Val – Valid (V) or Invalid (I) channel
- EpisodeID
- SceneID
- VehicleArrayID (receiver index inside the vehicle)
- VehicleName (e.g., “flow1.2”)
- X coordinate
- Y coordinate
- Z coordinate
- LOS flag: 1 = LOS, 0 = NLOS
This folder aligns channel labels, vehicle trajectories, and LOS states with the visual, LiDAR, and radio modalities.
📁 7. scenario_metadata/ — Simulation & Scenario Configuration
This folder includes text or JSON files describing:
- 3D environment (Rosslyn urban canyon)
- Wireless InSite simulation parameters
- Materials used (ITU concrete for buildings/ground)
- Propagation model (X3D)
- Number of reflections, diffractions, and rays
- Diffuse scattering configuration
- Vehicle types used in SUMO (cars, buses, trucks)
- Receiver heights and mobility profiles
These files ensure reproducibility and consistent environment reconstruction.
📁 8. documentation/ — README and Citation Information
This folder contains:
- Dataset README
- License and usage rules
- Citation generator references
- Links to related academic papers
- Change logs or updates